WordPress Debug: What Is It, How to Enable It, and Best Practices
The WordPress debug mode is a handy tool for identifying and resolving issues with a WordPress website. When enabled, it can display PHP errors, notices, and warnings that occur on your site, making it easier to locate the source of the problems.
The debug mode is vital in maintaining your WordPress website’s performance, especially after installing or configuring a plugin, theme, or core file. Fixing issues promptly prevents any disruptions from negatively impacting your live website and its user experience.
This article will show you practical ways to enable the debug mode in WordPress. We will also provide the best practices for WordPress debugging to optimize your site’s functionality.
What Is WordPress Debug?
Debugging is the process of identifying and fixing bugs or errors in your code, especially after installing or configuring plugins, themes, or core files. The most common way to enable the debug mode in WordPress is to modify the wp-config.php file or use a developer plugin.
How to Enable WordPress Debug
Mastering the debug process is crucial for WordPress web administrators. Besides saving you time and reducing maintenance costs, the debug mode helps identify security vulnerabilities before they jeopardize your site and brand.
This WordPress guide provides simple steps that even non-programmers can follow to enable the debug mode. We’ll start with the most common method ‒ editing the wp-config.php file. Later, you’ll also learn how to configure WordPress debug using a plugin and Hostinger’s hPanel.

1. Enable WP_DEBUG
WP_DEBUG is a PHP constant that triggers the debug mode in WordPress. The built-in debug mode is defined as FALSE by default, so you have to set its value to TRUE in the wp-config PHP file to activate it.
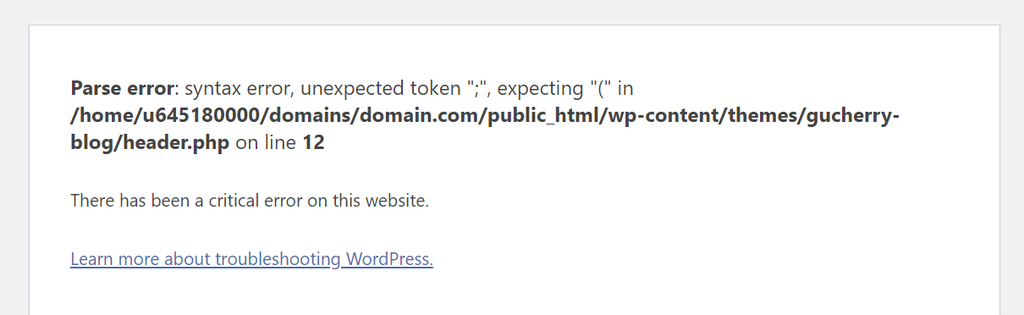
Important! Enabling the debug mode with this parameter will display error messages directly on your site. Therefore, we recommend using the debug mode only in a WordPress staging environment.
Follow these steps to enable WP_DEBUG:
- Access your root folder public_html using the file manager provided by your hosting provider or an FTP client like FileZilla. We’ll be using Hostinger’s File Manager, accessible via Files → File Manager in hPanel.
- Double-click on the wp-config.php file to open it, and locate the following code:
define( 'WP_DEBUG', false );
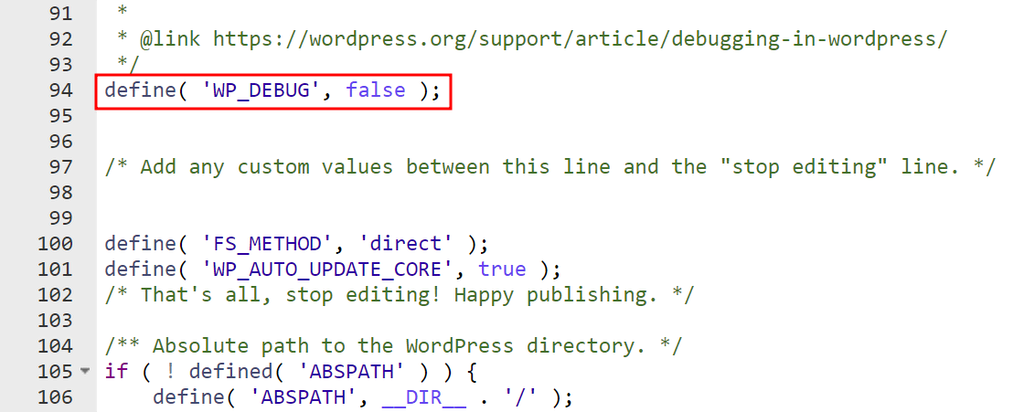
- Edit the value to TRUE. If you can’t find the line of code, add it above the /* That’s all, stop editing! Happy publishing. */ comment. If you’re using WordPress 5.0 or an older version, look for the /* That’s all, stop editing! Happy blogging. */ comment instead.
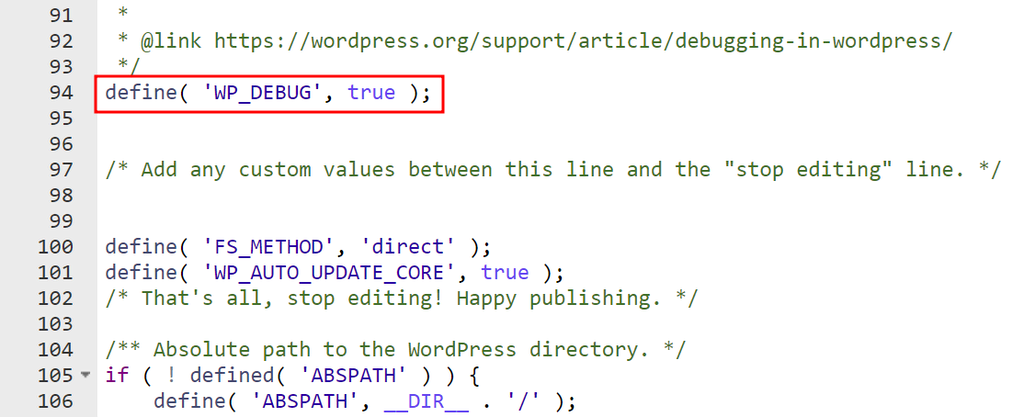
- Save the changes and load your website. Here’s an example of a warning message that appears when there’s an error in the website’s code:
2. Enable WP_DEBUG_LOG
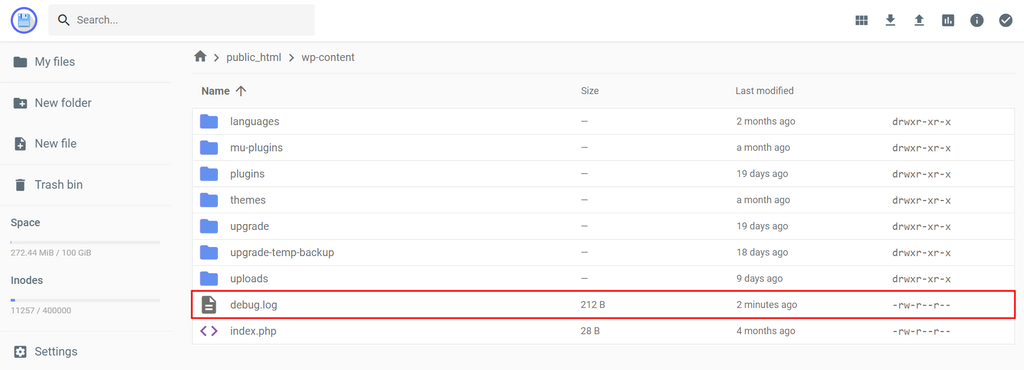
WP_DEBUG_LOG works in conjunction with WP_DEBUG. When set to TRUE, this PHP constant saves the errors, notices, and warnings detected by WP_DEBUG to a debug.log file located in the wp-content directory.
Having a dedicated debug log file makes the debugging process more secure, as it doesn’t show the WordPress errors on the live website. Therefore, you can review and troubleshoot issues while still maintaining the user experience.
Here’s how to enable the WordPress debug log and disable the display of errors on your site:
- Locate the wp-config.php file in your root folder.
- Open the configuration file and add the following PHP code above the /* That’s all, stop editing! Happy publishing. */ comment:
define('WP_DEBUG', true);
define('WP_DEBUG_DISPLAY', false);
define('WP_DEBUG_LOG', true);
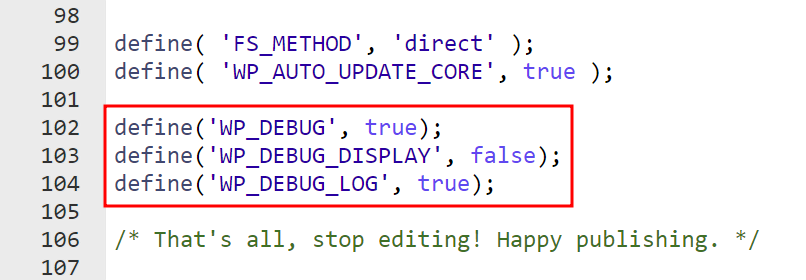
- Save the changes and load your WordPress site. If an error occurs, you’ll see a new debug.log file in the wp-content folder.
Important! Set WP_DEBUG to FALSE after debugging to disable the WordPress debug mode. Ensure WP_DEBUG_DISPLAY and WP_DEBUG_LOG are also set to FALSE. Enabling the WordPress debug mode indefinitely, even if you disable the display of errors, can negatively impact your site’s performance and drain server resources.
3. Enable SCRIPT_DEBUG
By default, WordPress improves site load times by using minified versions of JS (JavaScript) and CSS files. However, these minified files can sometimes conceal errors in scripts or plugins, which makes debugging more challenging.
SCRIPT_DEBUG addresses this issue by forcing WordPress to load the dev versions of core JS and CSS files. When enabled, this PHP constant enhances file readability by disabling compression and including complete comments.
SCRIPT_DEBUG is set to FALSE by default. Here’s how to enable it to identify errors in your site’s core JS and CSS files:
- Locate the wp-config.php file in your root folder.
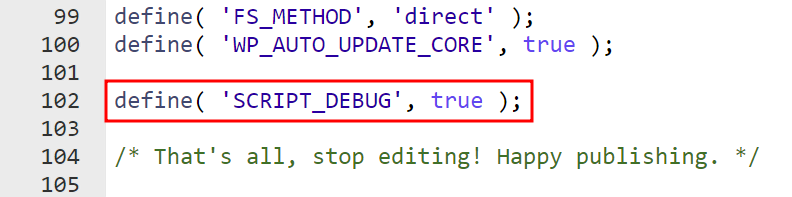
- Open the configuration file and add the following PHP code above the /* That’s all, stop editing! Happy publishing. */ comment:
define( 'SCRIPT_DEBUG', true );
- Save the changes.
You can also enable SCRIPT_DEBUG using WP Debugging. When activated, this WordPress plugin sets WP_DEBUG_LOG and SCRIPT_DEBUG constants to TRUE in the wp-config.php file. Conveniently, WP Debugging automatically removes them when you deactivate the plugin.
Check out our guide on different ways to install WordPress plugins.
Important! Disable SCRIPT_DEBUG after completing your debugging to improve your website’s performance. Using dev versions of CSS and JavaScript files can slow down load times, increase bandwidth usage, and cause plugin and theme conflicts.
4. Enable PHP Error Log
Another way to check your WordPress site for errors is to enable the PHP error log. This server-level feature operates based on the error_log() function. It logs errors for any PHP application running on the server, including WordPress-related ones.
Unlike the built-in debug mode, the PHP error log provides a secure and discreet way of tracking errors over time by recording issues in the background.
Here are the steps to enable PHP error logging using a Hostinger hosting plan:
- Navigate to Advanced → PHP Configuration from hPanel.
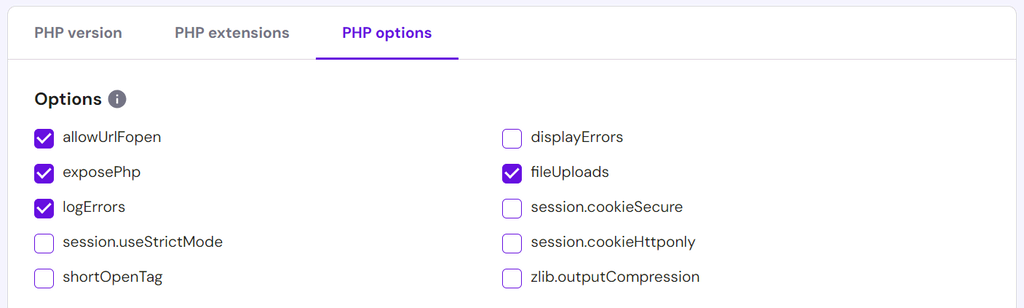
- Open the PHP Options tab and check the logErrors box. This step activates the error_log directive. Keep the displayErrors option unchecked to disable error display on your web pages.
- Scroll down to the bottom of the page and hit Save.
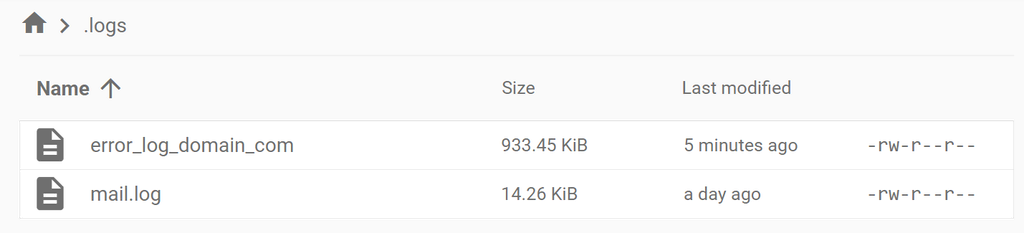
The system will generate the error_log file when it detects a PHP error. Here’s how to open the error log file:
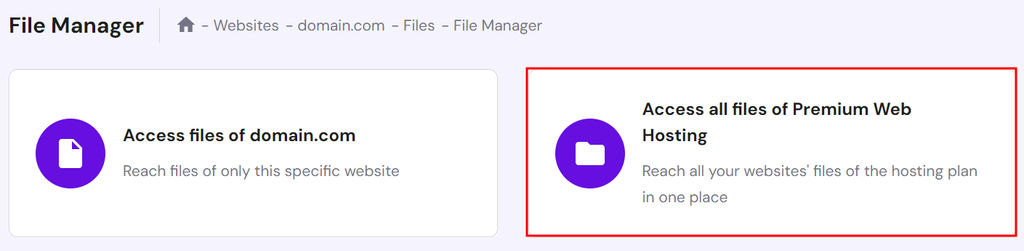
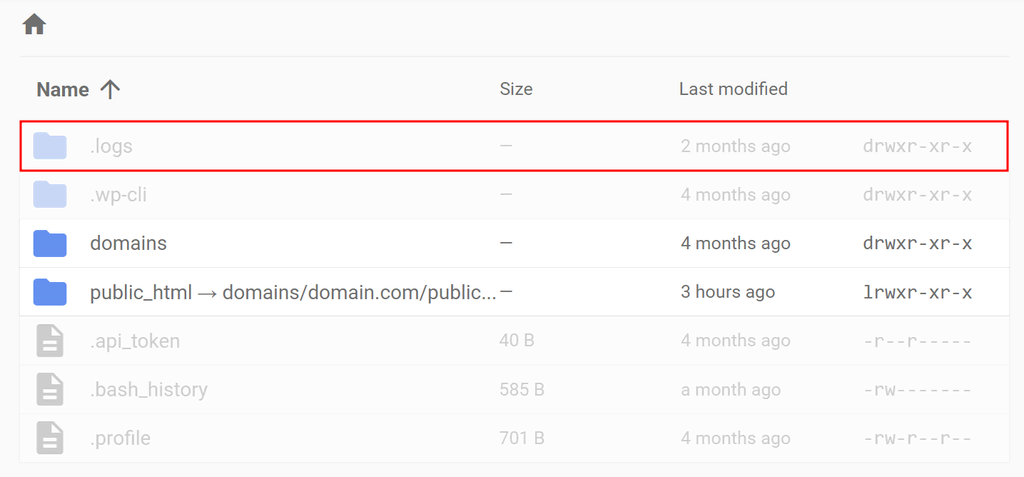
- Open File Manager and select the Access all files of Hosting option.
- Access the .log directory.
- Locate the error_log_[domain] file in it. It contains records of error log messages, including their date of occurrence and error type.
See our guide to check your website’s PHP error log using the .htaccess and php.ini files.
5. Enable WPDB Error Reporting
Enabling WPDB error reporting lets you detect and diagnose errors in database operations, such as syntax errors and database connection issues.
Calling the $wpdb->show_errors() method makes WordPress display SQL errors on the screen for future database queries. It’s particularly useful for identifying issues with query syntax or other database-related errors.
Here’s how to enable WPDB error reporting:
- Access the wp-includes folder in your root directory.
- Open the class-wpdb.php file. Press Ctrl + F and search for class wpdb.
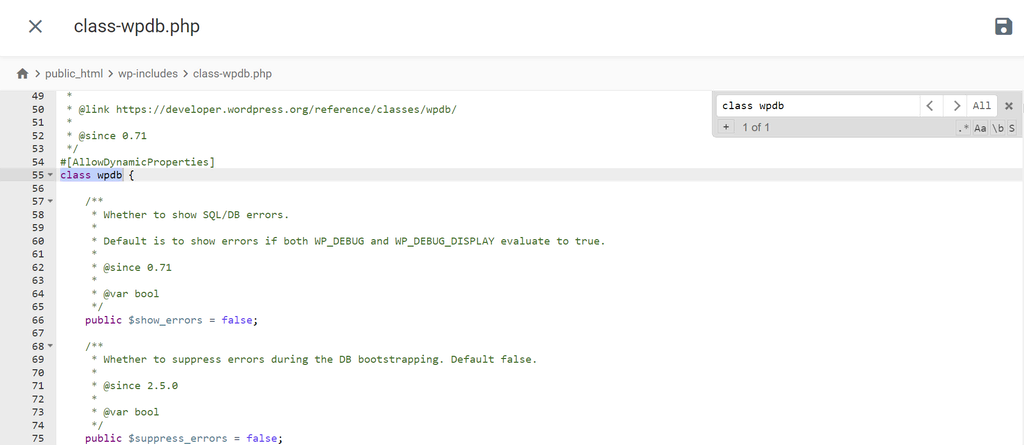
- The $show_errors variable is set to FALSE by default. Edit the value to TRUE to enable WPDB error reporting.
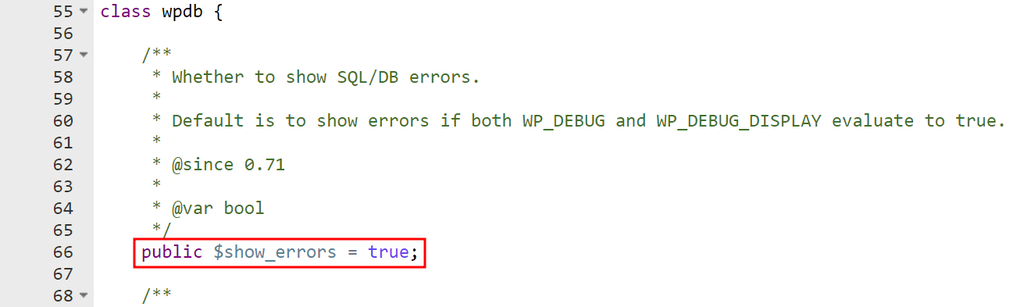
- Save the changes.
Important! Disable WPDB error reporting after debugging to maintain your site’s security and user experience. We recommend enabling it in a staging environment only.
Use a WordPress Debugging Plugin
If you want to enable debugging without modifying your core site files, leverage a WordPress debug plugin to streamline the configuration process.
Query Monitor, one of the best options available, can enable WP_DEBUG for database queries, PHP errors, enqueued scripts and stylesheets, and other WordPress elements.
Follow these steps to enable the WordPress debug mode with Query Monitor:
- Install and activate the Query Monitor plugin.
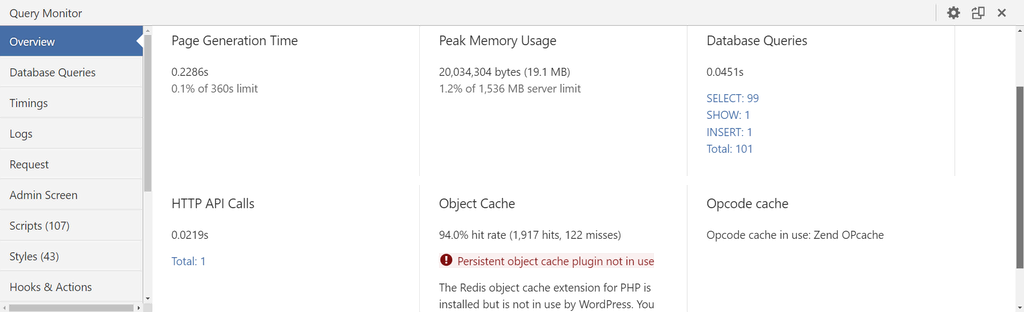
- Query Monitor’s settings are accessible from the admin’s top menu bar. It displays page generation time, peak memory usage, database query time, and the number of database queries by default. Click on it to expand the plugin’s settings.

- The Overview tab breaks down the four default components in detail. The presented information helps measure your WordPress site’s performance. It’s also helpful in detecting time-related errors, such as the Fatal Error: max_execution_time Exceeded error.
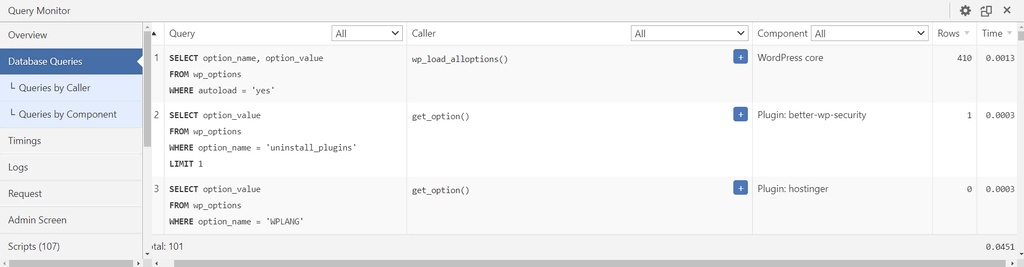
- The Database Queries tab tracks all database queries executed during a page request. It helps detect performance issues and potential database errors, such as the cause of the HTTP 500 Internal Server Error or error establishing a database connection.
- The Scripts and Styles tab lists all the queued JS scripts and CSS stylesheets on a page, including their dependencies and dependents. Refer to its information for debugging issues related to JS and CSS processing.
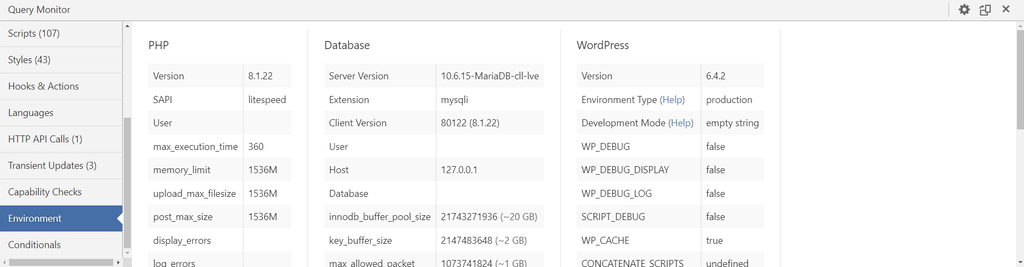
- The Environment tab provides detailed information on your website’s environment, from PHP configuration settings like upload_max_filesize to maximum database connections. Refer to it for debugging PHP-related issues, assessing plugin and theme compatibility, and troubleshooting the “There Has Been a Critical Error on Your Website” error.
WordPress Debug Best Practices
Implement these best practices and use recommended debugging tools for effective troubleshooting.
Use the WordPress Staging Environment
A staging site is a clone of your live website. It provides a controlled environment to test and fix code before pushing it to the live website. This helps prevent the debugging process from impacting your site’s user experience.
Hostinger users on the Business plan or higher can set up a WordPress staging environment by navigating to WordPress → Staging and clicking Create staging.

Alternatively, create a WordPress staging site by using a plugin or creating it manually.
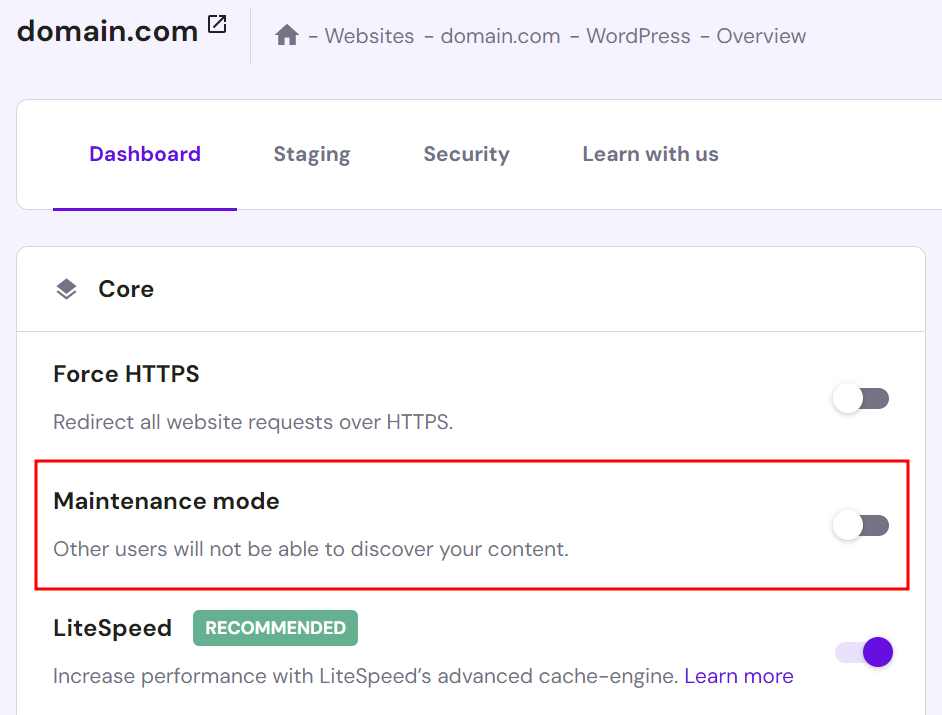
Use the Maintenance Mode
Enabling the WordPress maintenance mode forces your website to go offline. Visitors will be redirected to a dedicated landing page with a temporary maintenance message. This way, you can freely debug WordPress while maintaining a professional image.
Hostinger users can easily enable the maintenance mode from hPanel. Go to WordPress → Overview and click on the Maintenance mode switch.
Consider using plugins like LightStart or WP Maintenance to design a personalized maintenance page without coding. Some page builders like SeedProd also offer modules to enable this mode.
Use a Version Control
Using a version control tool like Git lets you track changes and revert to previous versions of your code. It also makes collaborating with other users easier, as changes are pushed to a remote server.
To learn more, read our article on integrating WordPress with GitHub – a popular and user-friendly web-based Git repository hosting service.
Conclusion
Knowing how to enable the debug mode in WordPress is a crucial skill for website administrators. You can quickly identify issues in a WordPress site and check for conflicts after installing or configuring plugins, themes, or core files. This ensures a smooth user experience with no disruptions.
Let’s recap the five effective methods to enable the WordPress debug mode:
- Enable WP_DEBUG to display detected errors on your web page.
- Enable WP_DEBUG_LOG to create a debug log file within the wp-content directory.
- Enable SCRIPT_DEBUG to load unminified versions of CSS and JavaScript files.
- Enable the PHP error log in hPanel to record PHP issues in a dedicated debug log file within the server directory.
- Activate WPDB error reporting to detect and diagnose errors in database operations.
Alternatively, use a WordPress debugging plugin to locate the source of problems without modifying core site files.
Finally, remember to disable the debug mode after debugging to ensure your site has enough resources to run optimally.
We hope this article helped you enable the WordPress debug mode on your site for effective troubleshooting. If you still have questions, check out our FAQ section or comment below. Good luck!
WordPress Debug FAQ
This section addresses common questions on how to debug in WordPress.
What Is the WordPress Debug Mode?
It’s a tool that makes debugging WordPress easy. Most developers recommend creating and using a dedicated WordPress debug log file to keep track of issues on your website rather than manually tracking your live website.
How Do I Check My WordPress Debug Mode?
Connect to your WordPress server. Open the wp-config.php file within the wp-content folder, and look for the line define( ‘WP_DEBUG’, true). Additionally, check WP_DEBUG_LOG and WP_DEBUG_DISPLAY settings for logging and display preferences.
How Do I Know if WP Debug Is Enabled?
The WordPress debug mode is enabled if the lines define( ‘WP_DEBUG’, true) and define(‘WP_DEBUG_LOG’, true) in wp-config.php are set to TRUE. You can also use the WP Debugging plugin to check the debug mode’s status.
How Do I See All the Errors in WordPress?
Enable WP_DEBUG_LOG in wp-config.php or Hostinger’s built-in PHP error log feature to record errors in a dedicated debug log file.

Jordana is a Senior Content Writer with over 5 years of experience in digital marketing and web development. When she’s not busy with work, she dabbles in creative writing and movie reviewing. Follow her on LinkedIn.