What Is First Input Delay and How to Improve It

The First Input Delay (FID), also known as input latency, calculates a website’s response time from the first user interaction to the browser’s response.
Scrolling and zooming cannot be measured with the first input delay as they are classified as animation aspects in the RAIL model. FID focuses solely on the responsiveness of a website, measuring the delay in processing user requests.
Analyzing the input delay is essential as it affects your website’s user experience. Even 25% of visitors will leave a website if it takes more than 4 seconds to load.
In this article, we will go over the first input delay, from its definition, importance, and optimization to its relation to other Core Web Vitals metrics. We’ll also explain how to test your FID score and why it might be low.

What Is First Input Delay (FID)?
The First Input Delay is a metric used to track the delay time of the browser until it responds to user input, including clicks and taps.
Why Is First Input Delay Important?
One of the factors that can affect the impression of a website is the first input delay. It is of the Core Web Vitals metrics, along with the Largest Contentful Paint (LCP), Cumulative Layout Shift (CSL), and the Interaction to Next Paint (INP).
With Core Web Vitals, you can measure your page performance as well as investigate a provided report to help you improve your site and put it on the top of the search engines.
Furthermore, those metrics impact user experience and a website’s ranking, affecting your search engine optimization (SEO) efforts. Page speed is one of the main Google ranking factors.
If the website takes a long time to respond to a user’s interactions, it will also make users frustrated.
As most responsiveness issues occur when a web page is loading, keeping the first input delay score low is vital.
Suggested Reading
Read our detailed tutorial on 10 effective strategies to improve your Core Web Vitals.
How to Test Your First Input Delay
Having gone over why the first input delay is important for your page, it is time to test it to improve your website performance for better user interaction.
Unlike the cumulative layout shift and the largest contentful paint, the first input delay can only be measured with real user interaction on the page.
Here’s the list of tools you can use to test your first input delay:
- Web Vitals JavaScript Library – built for front-end monitoring, the tool helps analyze every metric in a short time with high accuracy. Each metric defines as a single function, the onReport callback. After configuring your web-vitals library, the tool will report whether your pages have reached the recommended threshold.
- Chrome User Experience Report – also known as CrUX, this tool helps developers improve website usability with the Core Web Vitals and diagnostic metrics based on real user data. CrUX is supported by the standard web platform APIs, which means you can use the same APIs to collect the Real User Monitoring (RUM) data.
- Search Console Core Web Vitals Report – helps web developers fix poor user experience. It evaluates your website’s performance based on field data over 90 days by URL status, group, and metric type. Note that the report is only for indexed URLs and is based on Web Core Vitals. Thus, if a URL does not have sufficient information for any of the metrics, it will be omitted from the report.
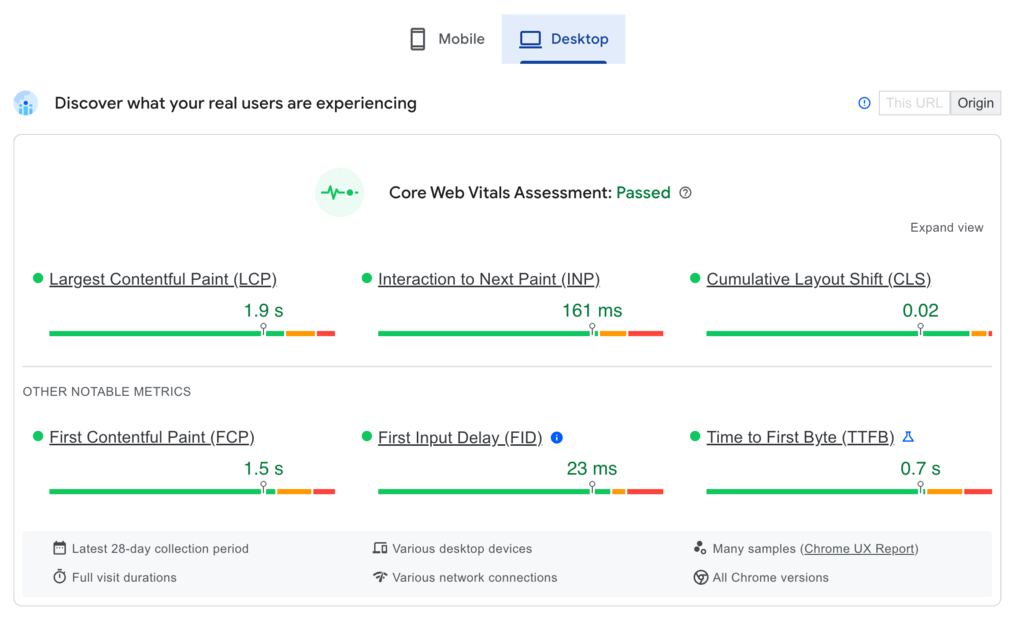
- Page Speed Insights – quickly checks the latest website performance. It divides the information into desktop and mobile users and data to fix user experience and debugging issues.
For example, if you want to use PageSpeed Insights to test your first input delay, just enter one URL in the search box. Having done so, you will get an assessment of Core Web Vitals on your page and suggestions to improve your page. You can also see how long the input delay is on your web page.
What Is a Good FID Score?
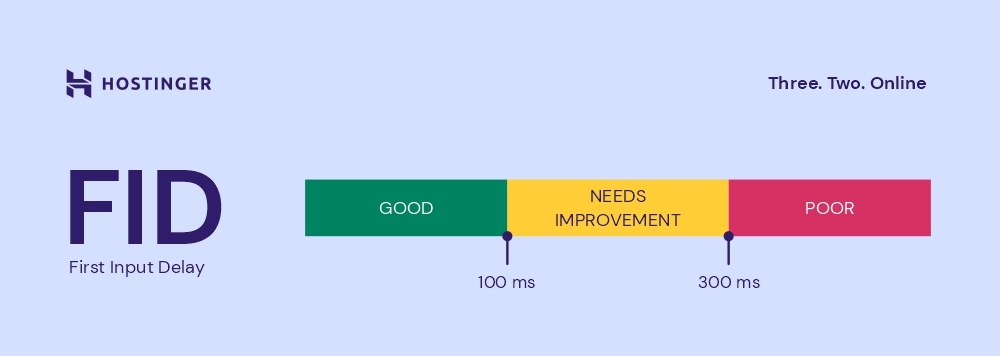
Generally, 0.1 seconds is the limit for having the user feel that the system is reacting instantaneously.
As a result, to get a good score from the first input delay and fast user input, a website needs an FID of less than 100 ms as the maximum. Ideally, it should have less than 100 ms from 75% of all page loads, including mobile and desktop devices.
The graph below shows how the first input delay score is categorized into good, needs improvement, and poor.
Max Potential First Input Delay
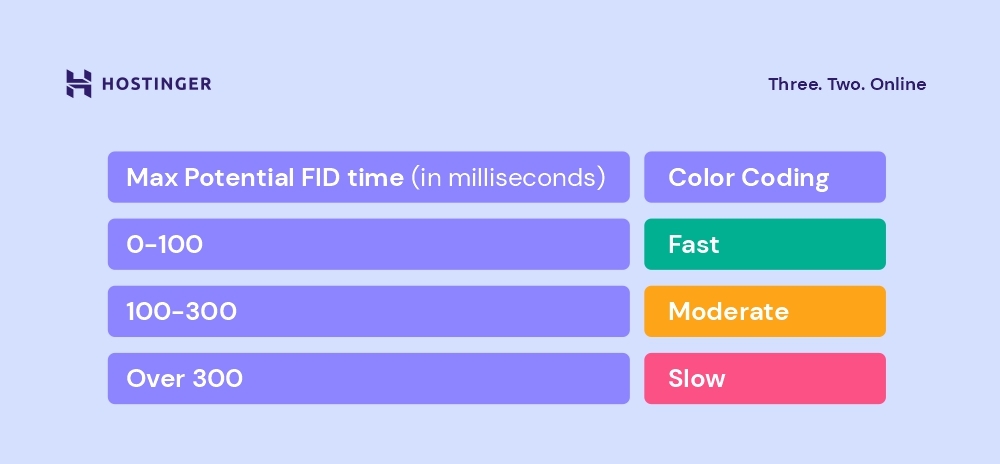
The Max Potential First Input Delay (MPFID) is the longest task of a page. The MPFID measures a page’s response time while the longest task is running. Note that the measurement starts only after the first contentful paint is calculated.
The score results are taken from the comparison of the max potential FID time with the max potential FID times in real websites. For example, if you get your MPFID a green score, it means that your page performs better than 90% of real websites.
How to Find the Cause of a Low FID Score
When you get a low first input delay score, identify which parts of the page need improvement to make your page work better.
One of the leading causes that make browsers unable to respond to user interactions promptly is user input getting blocked. It occurs when the browser’s main thread is busy doing other tasks.
These tasks usually include dealing with HTML, CSS, and Javascript, making them overworked. A long JavaScript task is a common error that causes the main thread to delay, and event listeners can’t run on the page. To find this problem, use PageSpeed Insights and look under the Avoid long main-thread tasks audit section.

8 Ways to Optimize Your First Input Delay (FID)
After learning how to test your FID score and finding out any potential causes, it is time to optimize it.
Usually, JavaScript has the most significant impact on your FID score. For that reason, it is essential to optimize your JavaScript code.
Follow the suggestions below to do so:
1. Divide Long Tasks Into Smaller Ones
Difficulty level: easy
Impact: high
When the browser’s main thread is busy and blocked, user requests cannot be processed. This makes the page unresponsive. The inadequate responsiveness is caused by a task running longer than 50 ms.
JavaScript tasks consume lots of resources that can affect your website speed performance. To solve this problem, remove them or divide long tasks into smaller, asynchronous ones. At least, one task should take under 50 ms.
You can use the setTimeout function to break long tasks into smaller tasks as it will make the main thread respond to user inputs without delay.
2. Implement Progressive Loading
Difficulty level: medium
Impact: high
Having a fast-loading website can improve its user experience. Many components, such as large images or JavaScript tasks, slow web browsers down.
To solve this issue, create progressive loading code by bundling all your JavaScript files into bundle.js. For this, you can use a webpack.
Bundling also helps you minimize the page size and remove unused code or more easily minify it. Moreover, it makes the browser only load UI components when required.
3. Move Logic to Server-Side
Difficulty level: hard
Impact: high
Server-side rendering (SSR) refers to displaying web pages on the server.
With the server-side render, your page is displayed quickly without waiting for resources to become available. It can solve indexed pages and crawl budget issues, benefiting your SEO.
Moreover, server-side rendering can increase the speed of the first contentful paint and time to interactive (TTI) by avoiding sending large JavaScript files to the client. As a result, your web page load will run faster.
You can render the server-side version using front-end frameworks like Vue, React, or Svelte. Before using those applications, make sure you have installed Node.js to run JavaScript on the server.

4. Generate Content Statically
Difficulty level: medium
Impact: high
Unlike server rendering, static rendering generates a single HTML page prepared once at build time. It helps the user access the page ahead of time.
You can use a static site generator, like Gatsby, to create static HTML pages from data, content, and templates. Then, it will generate a view of a page that can be served to the users.
Note that static rendering is not suitable for large sites that contain many pages or require response changes on every request. By generating all of your content, the site needs to be deployed and tested, affecting real-time updates. Moreover, your deployment could become impractical.
5. Review Third-Party Script Execution
Difficulty level: hard
Impact: high
A slow page loading time can be caused by a third-party script that adds functionality to websites, such as live chat, ads, and analytics. Third-party code can cause problems, like processing too many network requests to different servers sending large JavaScript tasks or images files that block the main thread.
To review your third-party scripts, you can test your site on PageSpeed Insights. It will show you lists of the loaded third-party resource, along with the transfer size and the main thread blocking time.
Use async or defer attributes to improve your loading times in the third-party scripts. Doing so will help you eliminate the rendering blocking issue and trigger a faster web page loading process. Important scripts that are vital to the page load should not use async or defer attributes as it is only for external scripts.
6. Utilize Web Workers
Difficulty level: hard
Impact: high
Web workers help reduce the main thread blocking time and improve the FID score of your site. They allow you to put long tasks on the background thread without interfering with the user interface, making your website more responsive.
Use the Worker(“path/to/worker/script”) code to create a worker. It can send messages to the JavaScript code by posting messages to an event handler specified by that code and vice versa. Additionally, a web worker can perform input or output tasks using the XMLHttpRequest or a fetch.
To help you use a web worker, check out the following libraries:
- Comlink – a tiny library that simplifies the use of postMessage/.
- Workway – a web worker exporter.
- Workerize – a webpack loader that moves a module into a web worker.
7. Optimize Unused and Non-Critical JavaScript
Difficulty level: hard
Impact: high
Too many JavaScript tasks will take a lot of time to be parsed and executed. As a result, the browser’s response time will be delayed. The browser will pause when it finds a script tag that links to the external JavaScript code. That’s why it’s important to run only the needed code.
There are some options to optimize JavaScript, such as code-split and defer any non-critical JavaScript. Before that, you can use the Coverage tab in Chrome DevTools to see how much unused JavaScript is on your web page.
Code-splitting allows you to split a JavaScript bundle into chunks and help your page load only when needed. This is also known as lazy loading. Meanwhile, to defer any non-critical Javascript task, always use async or defer for scripts that are not vital for the critical rendering path or above the fold.
8. Revise Polyfills Usage
Difficulty level: hard
Impact: low
Polyfill is code used to provide modern features on older browsers that do not natively support it. For example, when using modern JavaScript syntax and browser APIs to create code, you will need to transpile it and deliver polyfills so that the modern features will run in older browsers.
The usage of polyfills will create more bundles that will take a longer time to load for the browser. Therefore, it is essential to minimize the unused polyfills and only use them when needed.
To cut down the load time needed for your web page, you can use a JavaScript compiler, such as Babel, and use @babel/preset-env to include the required polyfills for older browsers. You can also cut down unused polyfills by enabling the bugfixes option for Babel 7.9.
Alternatively, deliver two separate bundles using module/nomodule to optimize polyfills.
First Input Delay in Relation to Other Metrics
The First Input Delay (FID) is a metric that must be tested with a data field based on real user interaction. Additionally, you should monitor other metrics that correlate with FID.
Let’s analyze in detail how the other metrics relate to FID scores.
First Input Delay vs. First Contentful Paint (FCP)
The first contentful paint measures how long it takes to load on a page from initial loading until the content is displayed on the screen. The page content comes from the Document Object Model (DOM), including images, text, or charts.
Meanwhile, the first input delay measures how long it takes for a browser to respond. These two things significantly affect the user’s first impression before and after interacting with the page. FID and FCP have a solid correlation to give users a better first impression.
In addition, a fast FCP helps users be aware that the information they request is being processed, making them stay on the site.
First Input Delay vs. Time to Interactive (TTI)
Time to Interactive (TTI) measures how long it takes for a page to become fully interactive. The measurement starts after the FCP is performed when the user can interact on the page.
A fully interactive page means a page responds to user interaction in less than 50 ms, and event handlers are registered for the majority of visible page elements.
By knowing your TTI, you can identify whether your website pages are entirely usable. Along with good FID, your pages can be fully interactive as the user needs.
First Input Delay vs Total Blocking Time (TBT)
Total Blocking Time (TBT) and FID are pretty similar. They both measure how long the response time on the page is. The difference is TBT does not use user input. In short, TBT is the amount of time during which long tasks block the main thread.
Long Javascript tasks on web pages can affect FID and TBT assessments. By looking at the FID and TBT metrics, you can see how significant the impact of long tasks is on the site’s responsiveness.
These two metrics create a strong correlation and influence each other in the usability of a page. Therefore, increasing your TBT score can be used to optimize your FID.
Learn More About Other Core Web Vitals
Largest Contentful Paint (LCP): What It Is and 11 Ways to Improve It
Cumulative Layout Shift (CLS): What It Is and How to Improve It
INP: Understanding the New Core Web Vitals Metric and How to Optimize for It
Conclusion
Having a responsive website significantly impacts your website’s user experience. That’s why testing and analyzing core web vitals is essential, including the first input delay (FID). By doing so, you can improve the performance of your website pages.
The most common issue that causes long input delays is a blocked main thread. It is usually caused by unoptimized JavaScript. Therefore, to improve the first input delay score, optimize your JavaScript code by:
- Breaking up long tasks.
- Implementing progressive loading.
- Using server-side rendering.
- Generating content statically.
- Auditing third-party scripts.
- Using web workers.
- Deferring unused and non-critical JavaScript.
- Restricting polyfills usage.
After you modify a page, test your browser and ensure that the website is optimized and working properly. If you have any questions or thoughts about improving your first input delay score, do not hesitate to share them in the comments section below.

Dinda is a WordPress and digital marketing enthusiast. She loves to share her knowledge with others so that they can be successful in their online endeavors. During her free time, she enjoys watching movies and exploring historical places.